


Desmos Graphing Calculator Desmos Graphing Calculator
Category
EducationVersion
V6.7.0.0
Tag
Desmos graphing calculator | interactive mathematics | graphing functions | data plotting | mathematical exploration
Rate
4.50
★★★★★
Reviews
500 +
Installs
5M +
Developer
Desmos Inc
Content Rating
Everyone
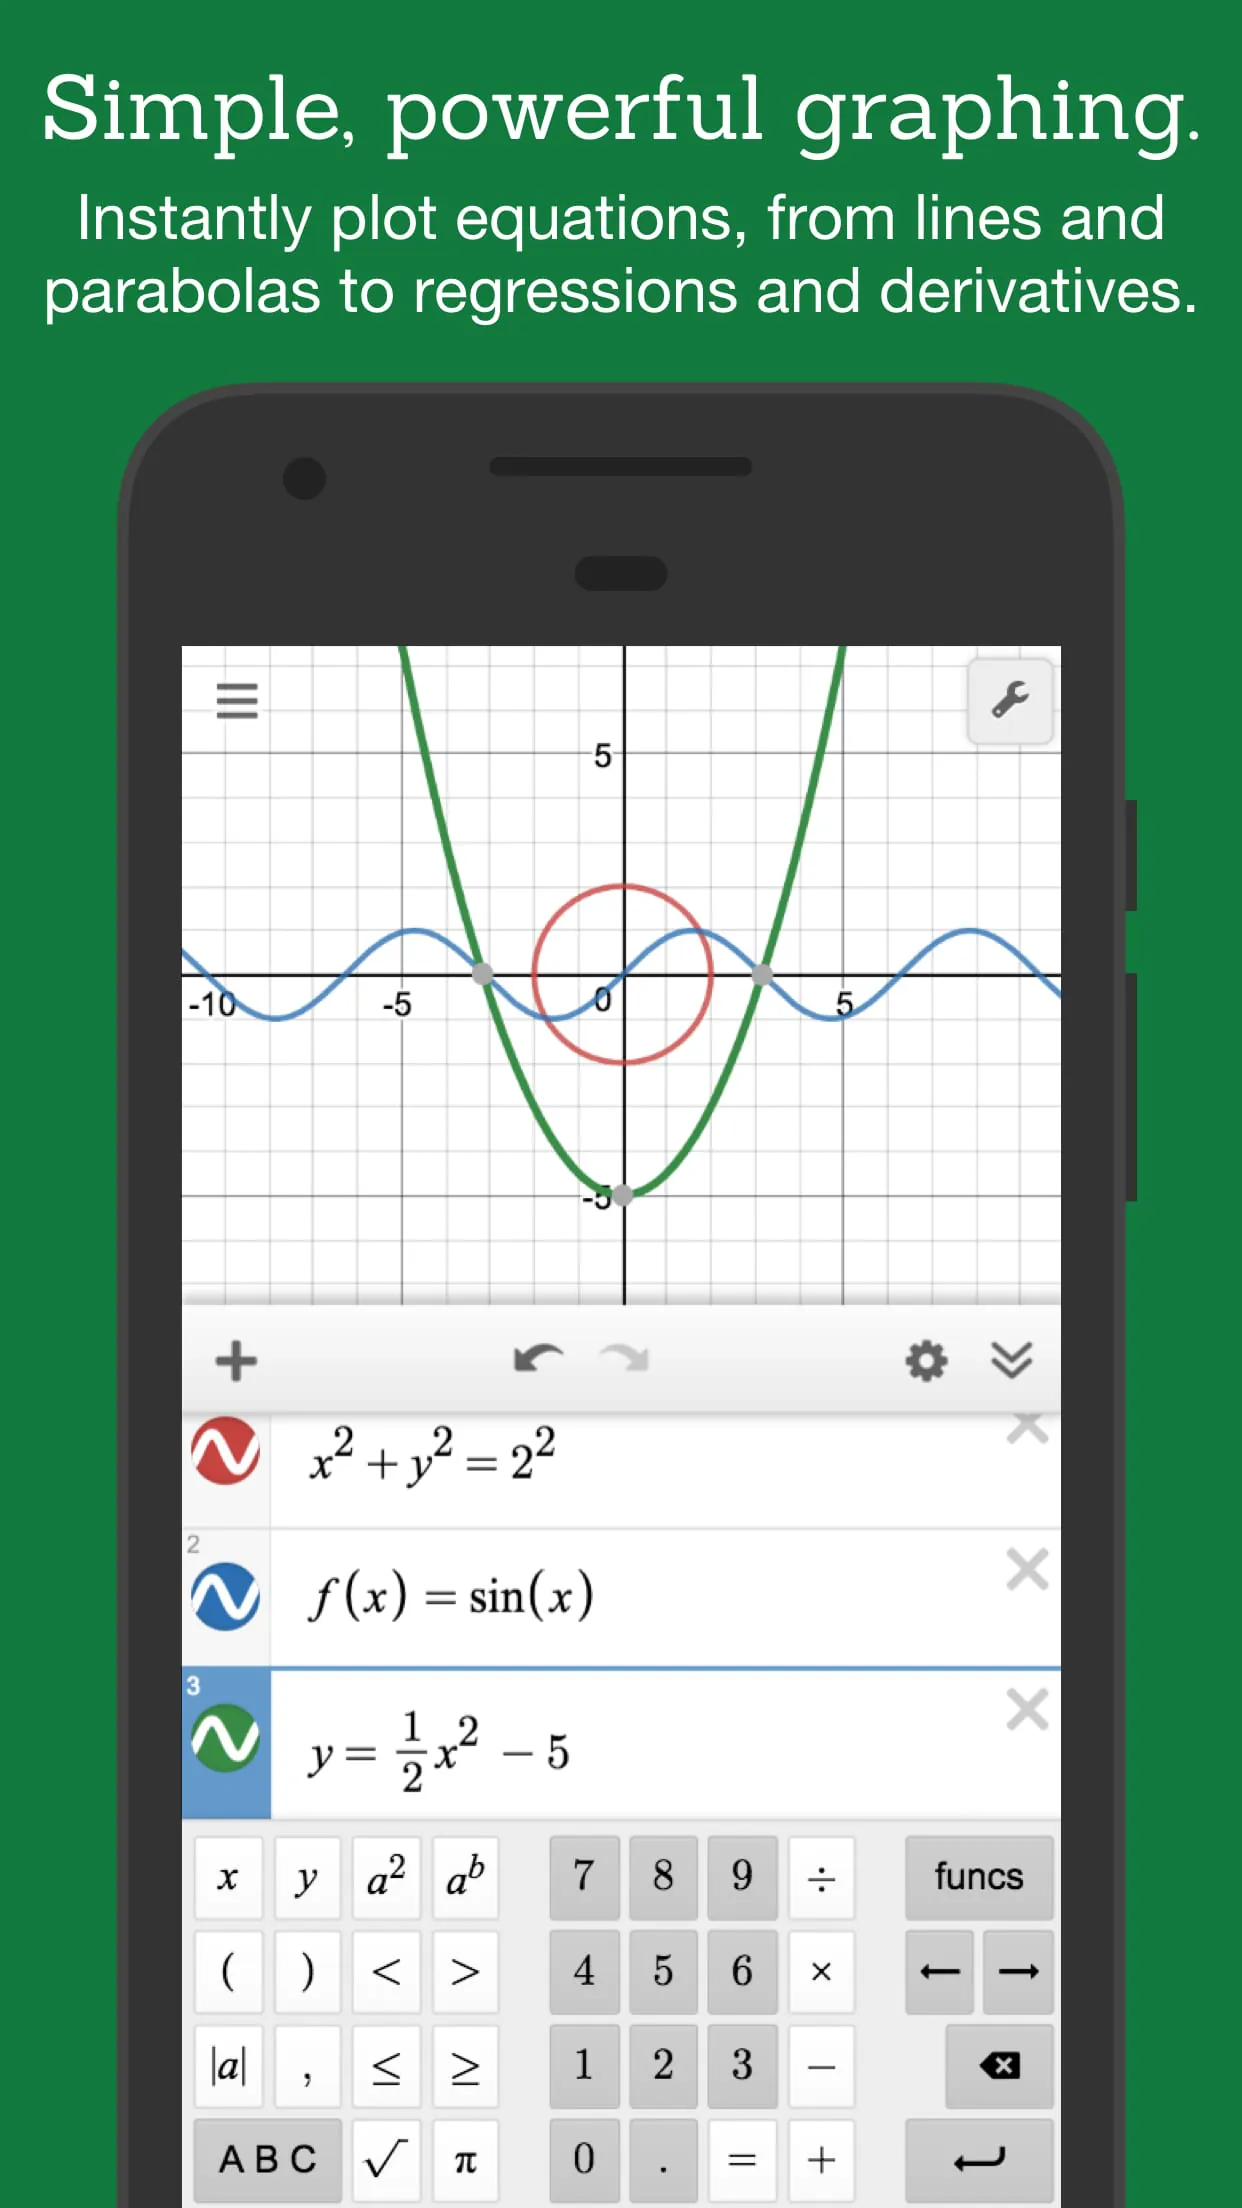
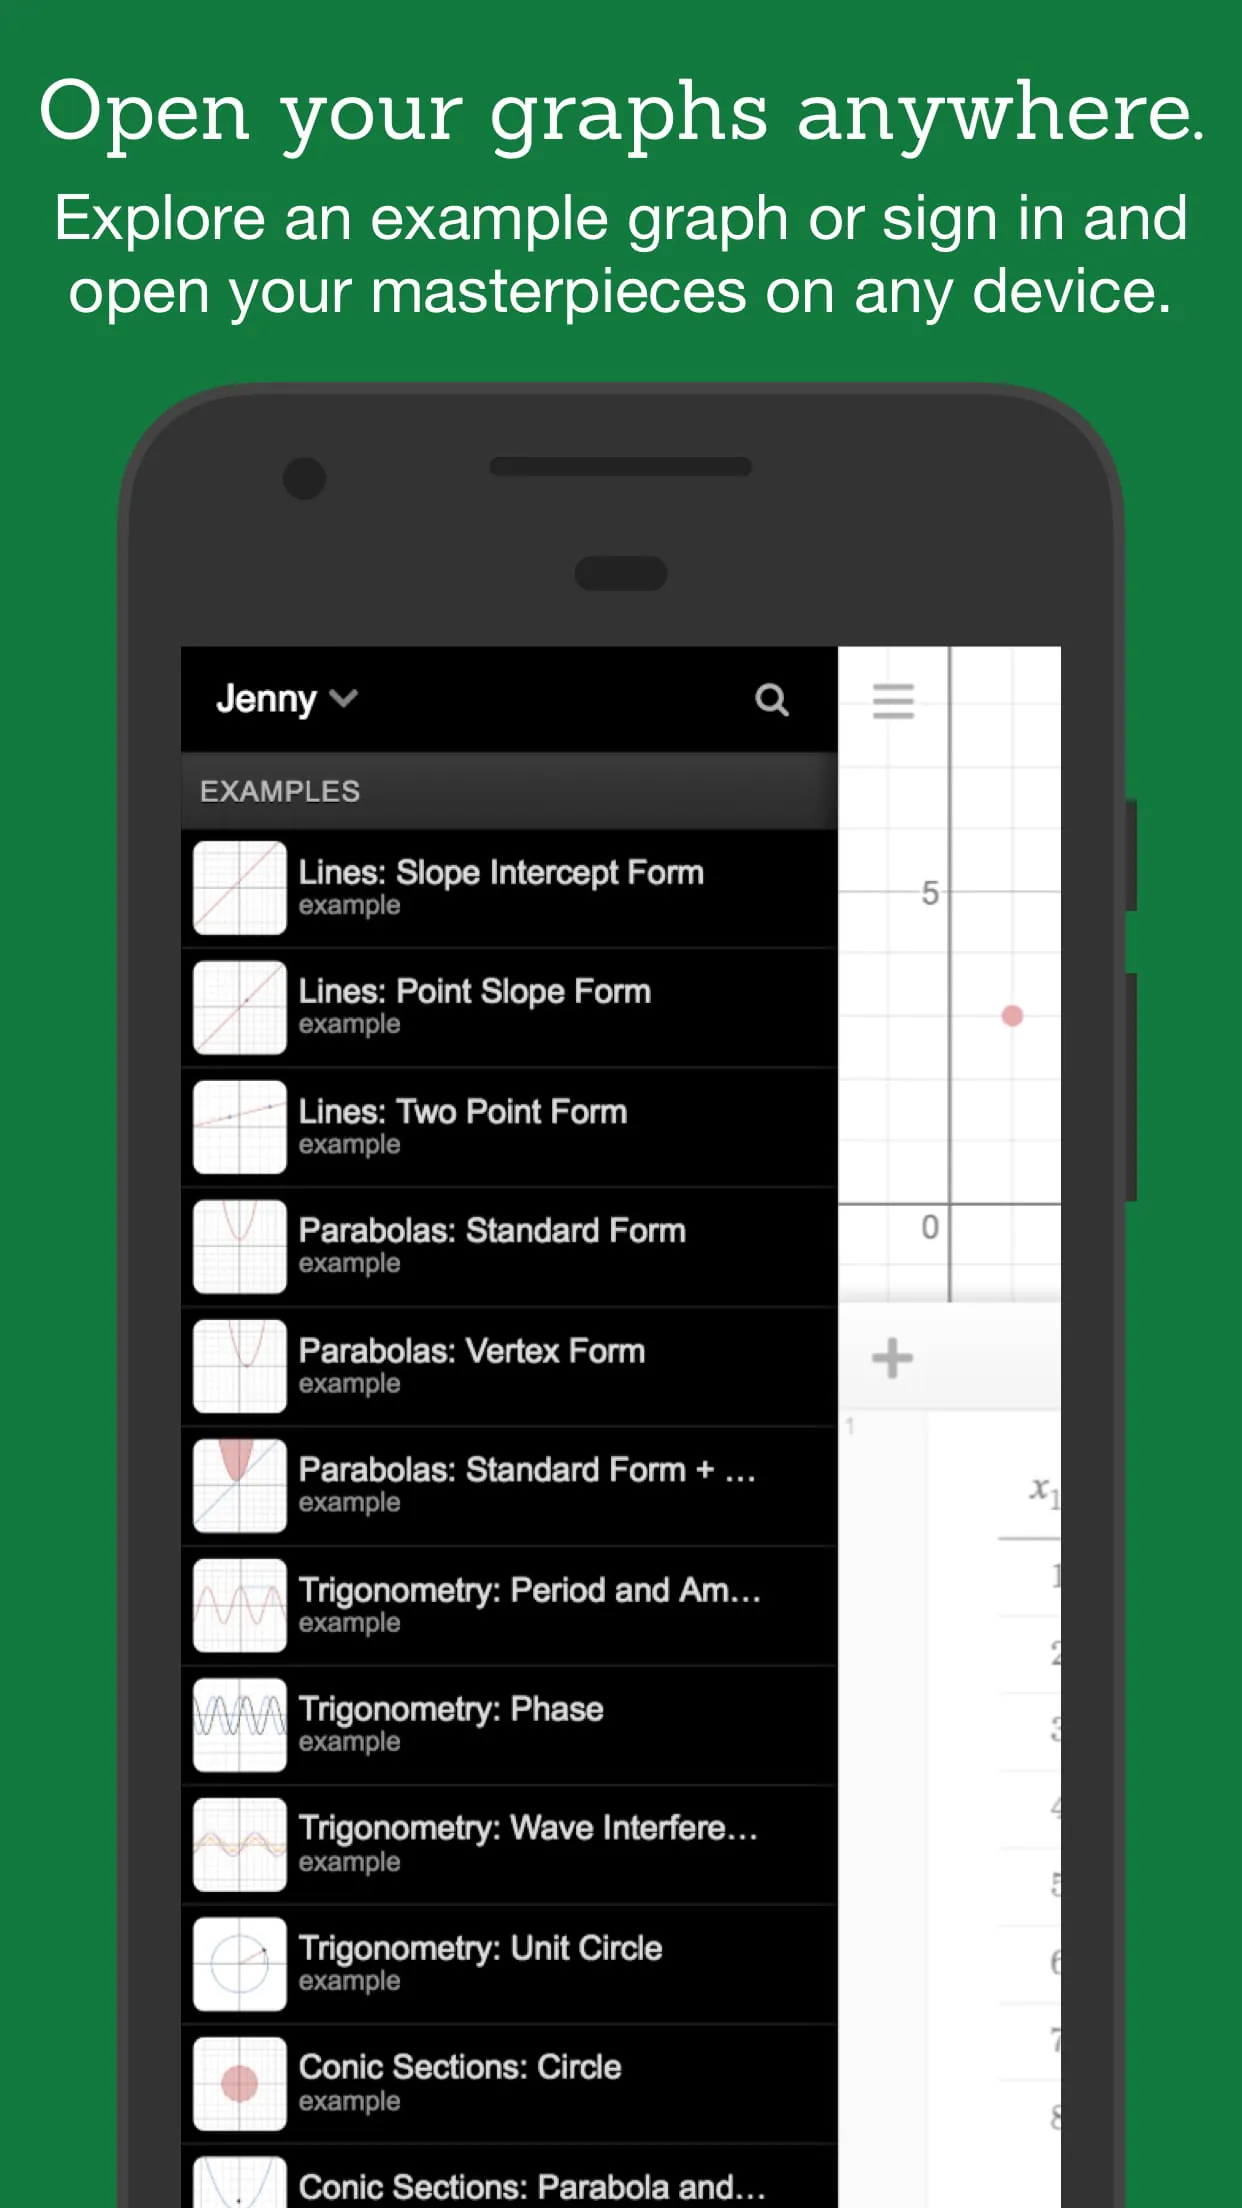
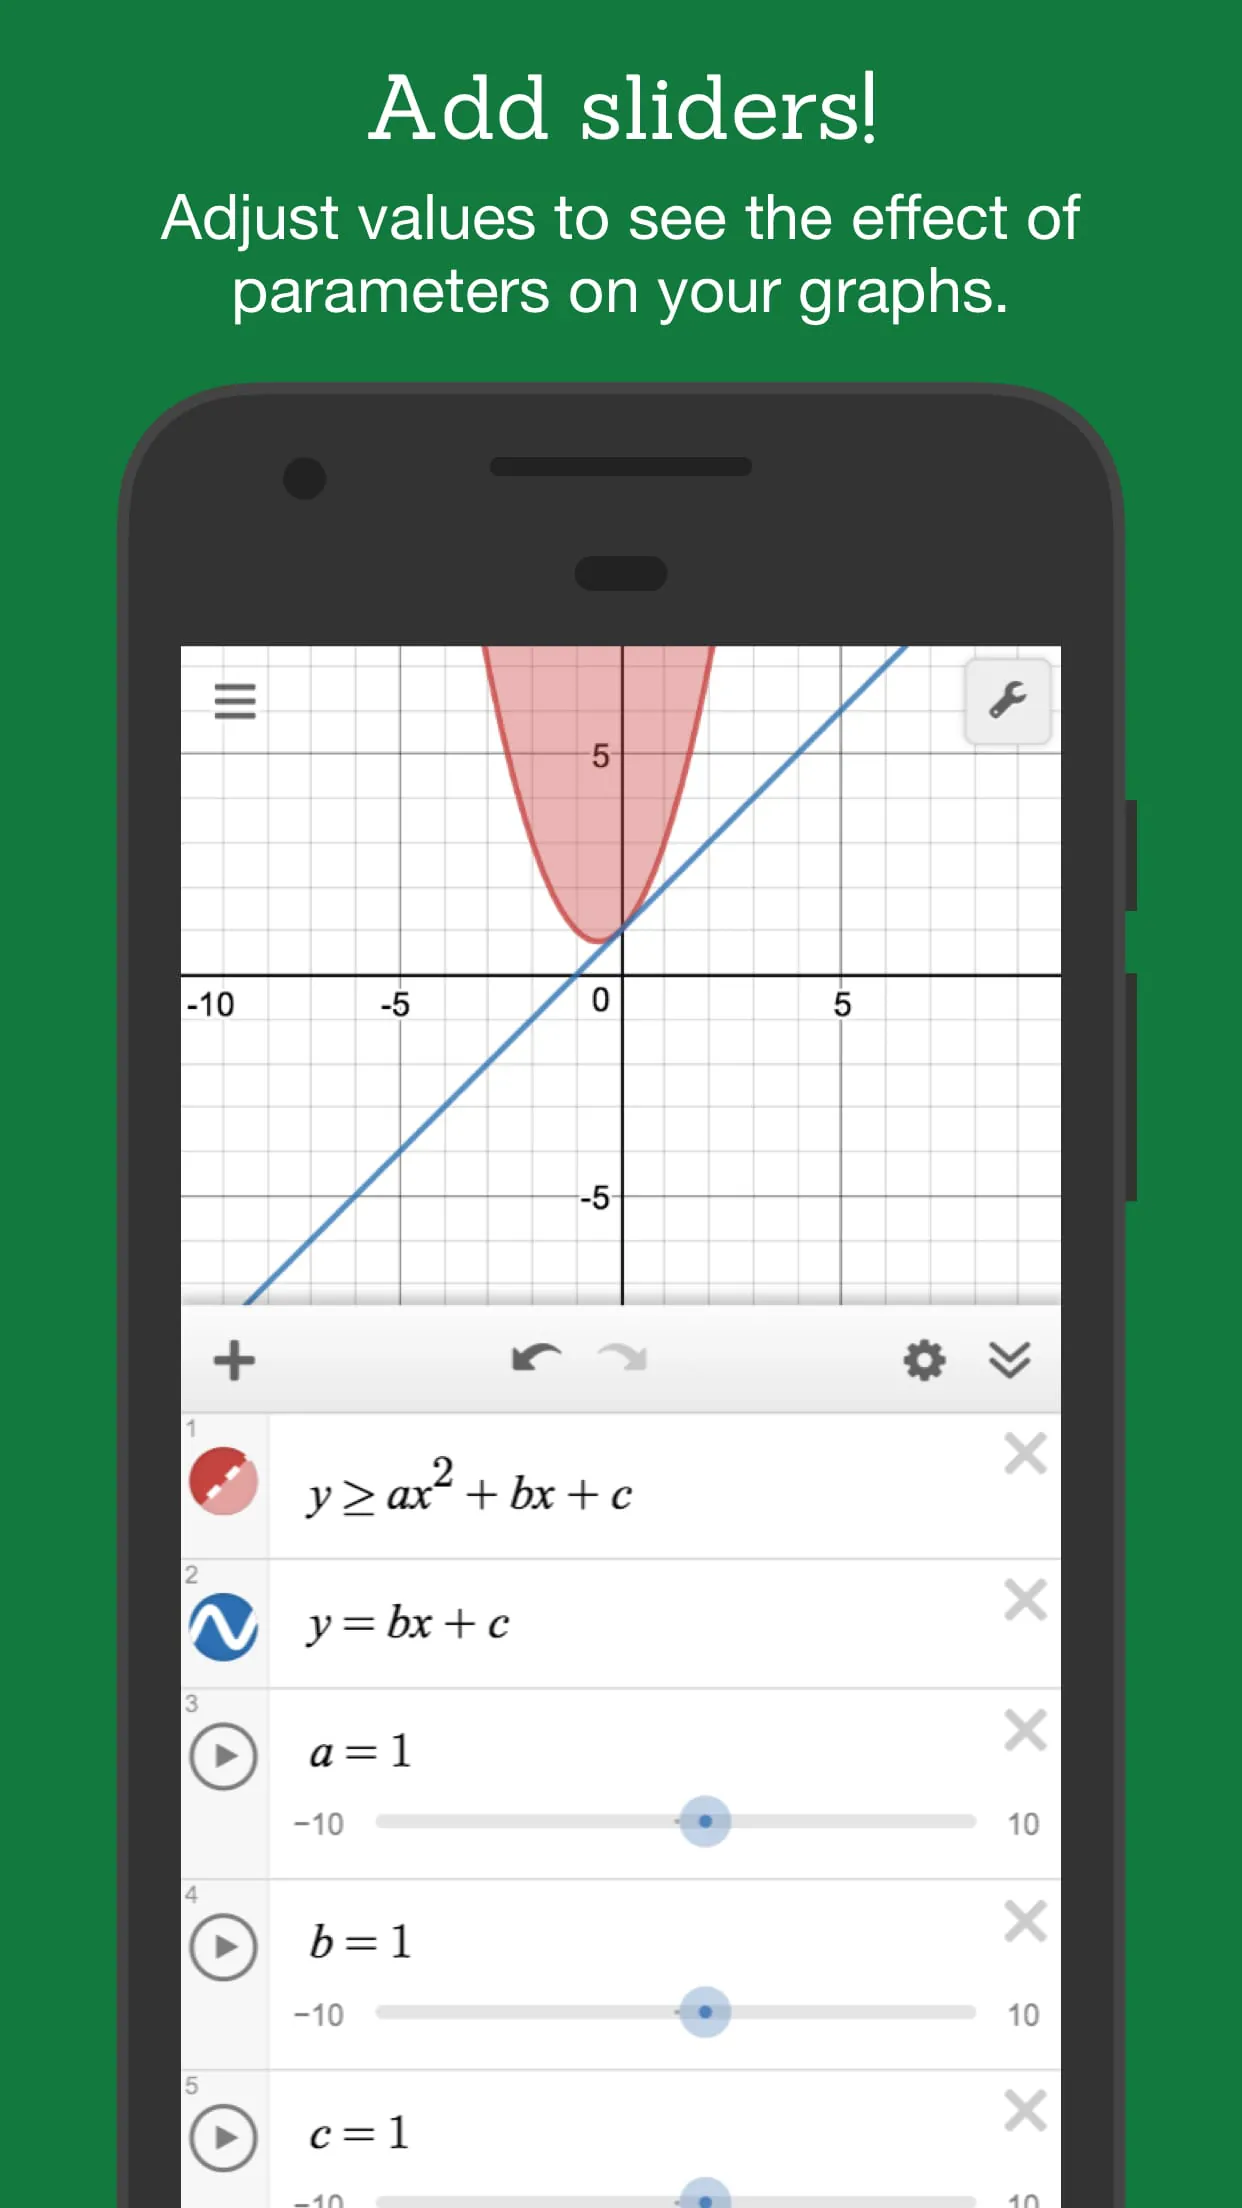
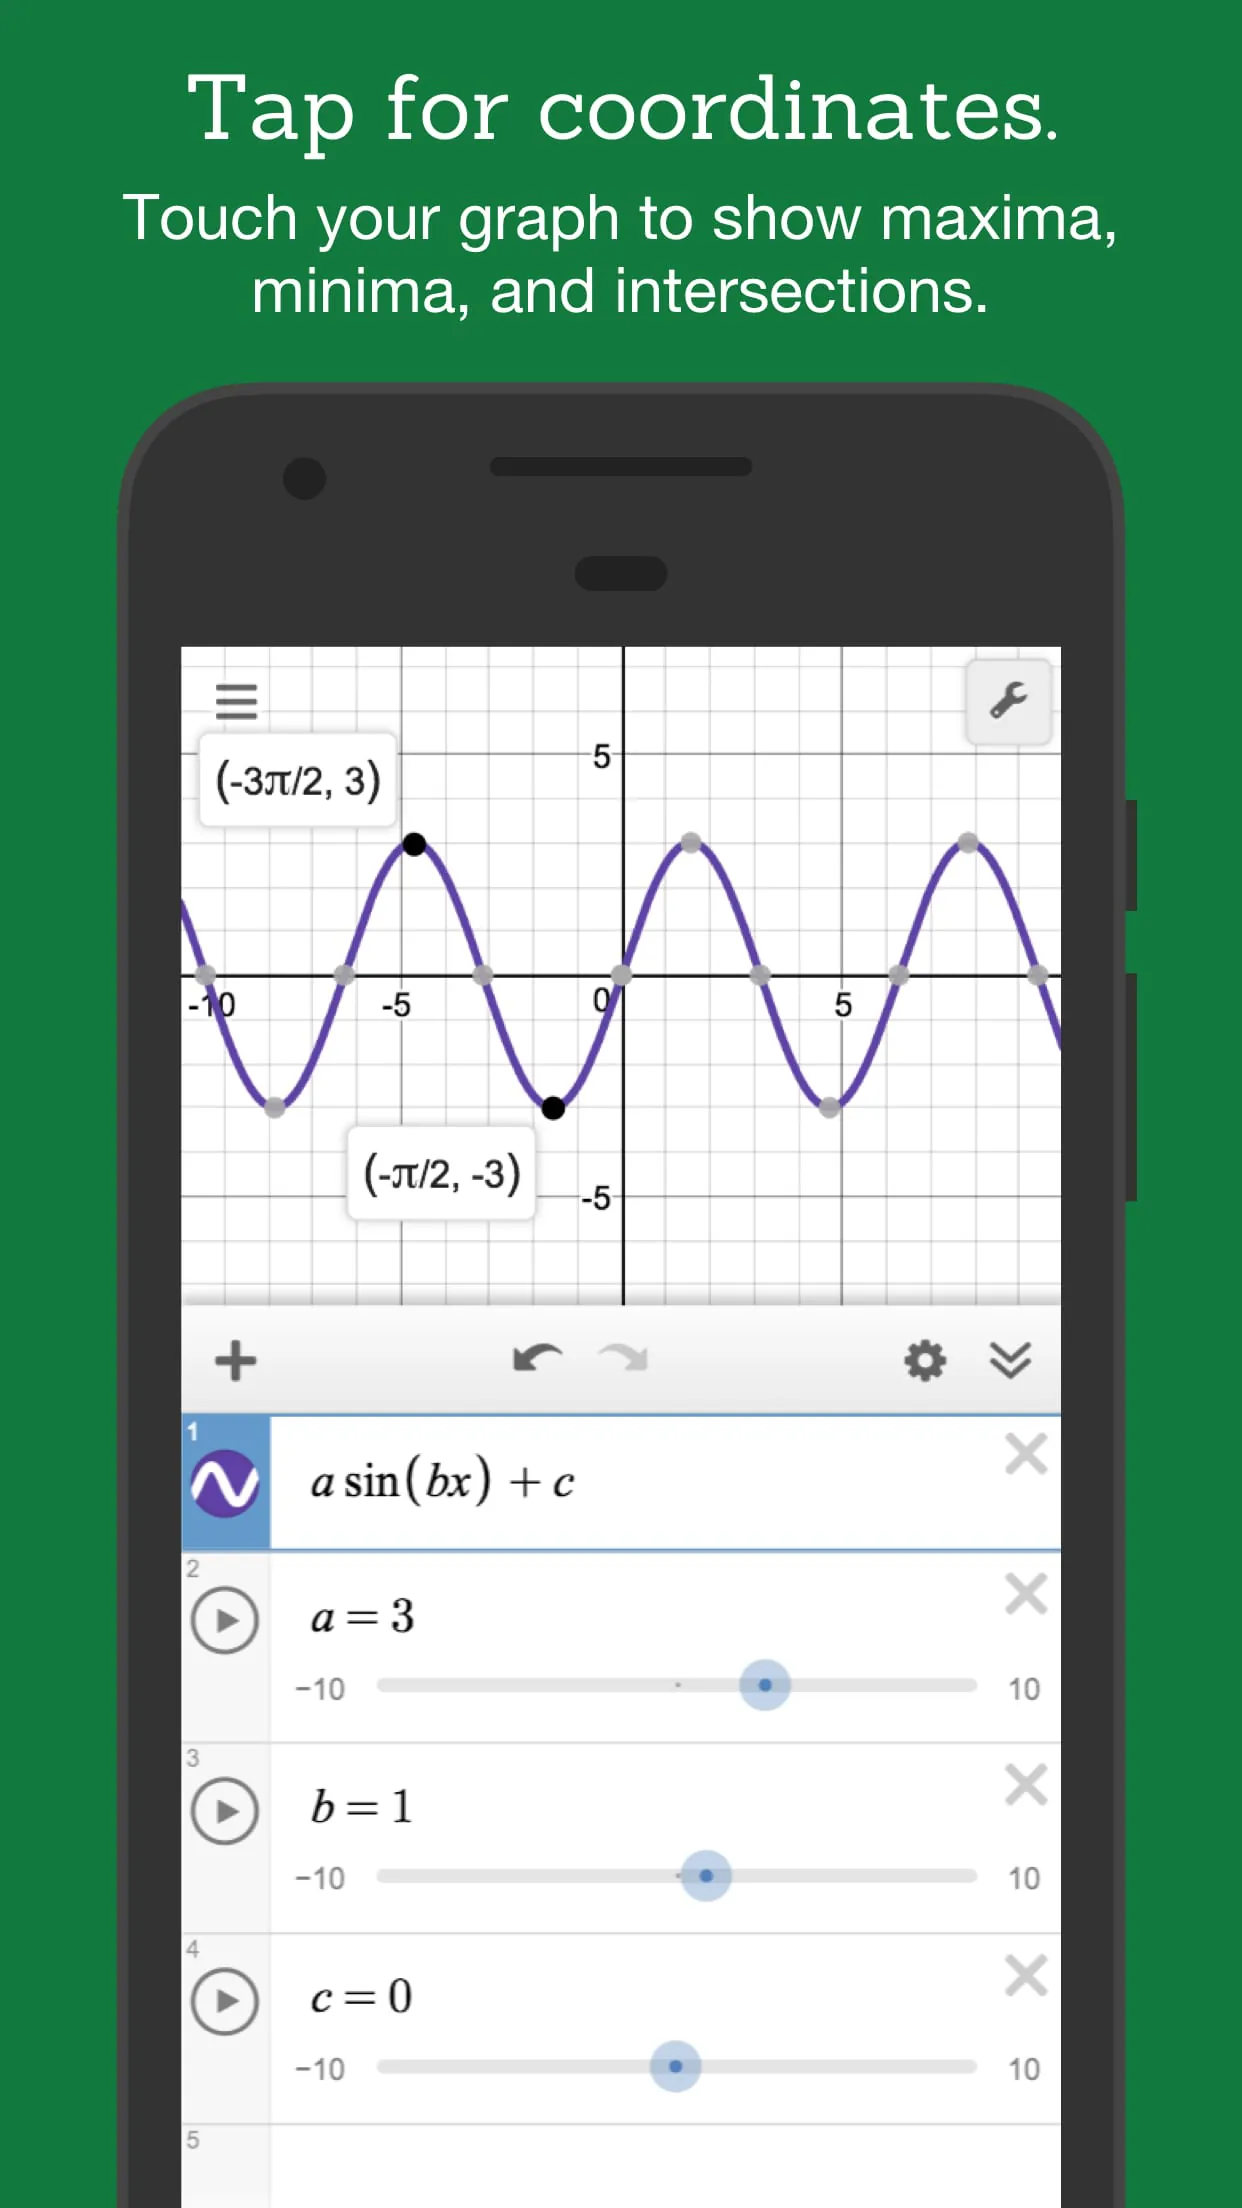
Explore math with Desmos! Plot functions, create tables, add sliders, and more.
 4.50
4.50 Advertisements
Advertisements
Author's Review
appspicked Review
Advertisements
Advertisements
Screenshots
Additional Information
Category
EducationVersion
V6.7.0.0
Tag
Desmos graphing calculator | interactive mathematics | graphing functions | data plotting | mathematical exploration
Rate
4.50
★★★★★
Reviews
500 +
Installs
5M +
Developer
Desmos Inc
Content Rating
Everyone
Explore math with Desmos! Plot functions, create tables, add sliders, and more.
Previous Versions
ZIP files require a Split APKs Installer (e.g., SAI) from Google Play to install. Steps: 1. Download SAI from Google Play; 2. Open SAI and tap "Install APKs"; 3. Select the ZIP file; 4. Complete installation.
V7.37.0.0

Package Name
com.desmos.calculator
Version Name
V7.37.0.0
Version Code
V7.37.0.0
File Size
6.12 MB
Update time
2025-12-20
V7.20.0.0
Package Name
com.desmos.calculator
Version Name
V7.20.0.0
Version Code
V7.20.0.0
File Size
4.82 MB
Update time
2024-12-18
V7.14.0.0
Package Name
com.desmos.calculator
Version Name
V7.14.0.0
Version Code
V7.14.0.0
File Size
4.57 MB
Update time
2024-5-16
V7.13.0.0
Package Name
com.desmos.calculator
Version Name
V7.13.0.0
Version Code
V7.13.0.0
File Size
4.52 MB
Update time
2024-3-8
V7.4.0.0
Package Name
com.desmos.calculator
Version Name
V7.4.0.0
Version Code
V7.4.0.0
File Size
2.5 MB
Update time
2023-5-2
V6.16.0.0
Package Name
com.desmos.calculator
Version Name
V6.16.0.0
Version Code
V6.16.0.0
File Size
3.38 MB
Update time
2022-9-14
V6.12.0.0
Package Name
com.desmos.calculator
Version Name
V6.12.0.0
Version Code
V6.12.0.0
File Size
3.3 MB
Update time
2022-3-31
V6.11.0.0
Package Name
com.desmos.calculator
Version Name
V6.11.0.0
Version Code
V6.11.0.0
File Size
3.3 MB
Update time
2022-2-2
V6.10.0.0
Package Name
com.desmos.calculator
Version Name
V6.10.0.0
Version Code
V6.10.0.0
File Size
3.3 MB
Update time
2022-1-19
V6.8.0.0
Package Name
com.desmos.calculator
Version Name
V6.8.0.0
Version Code
V6.8.0.0
File Size
3.3 MB
Update time
2021-12-2
V6.7.0.0
Package Name
com.desmos.calculator
Version Name
V6.7.0.0
Version Code
V6.7.0.0
File Size
3.3 MB
Update time
2021-9-8
You Might Like


Advertisements